Jethro Emmanuel
Home
Papers
Blog
Categories
All
(6)
Blog
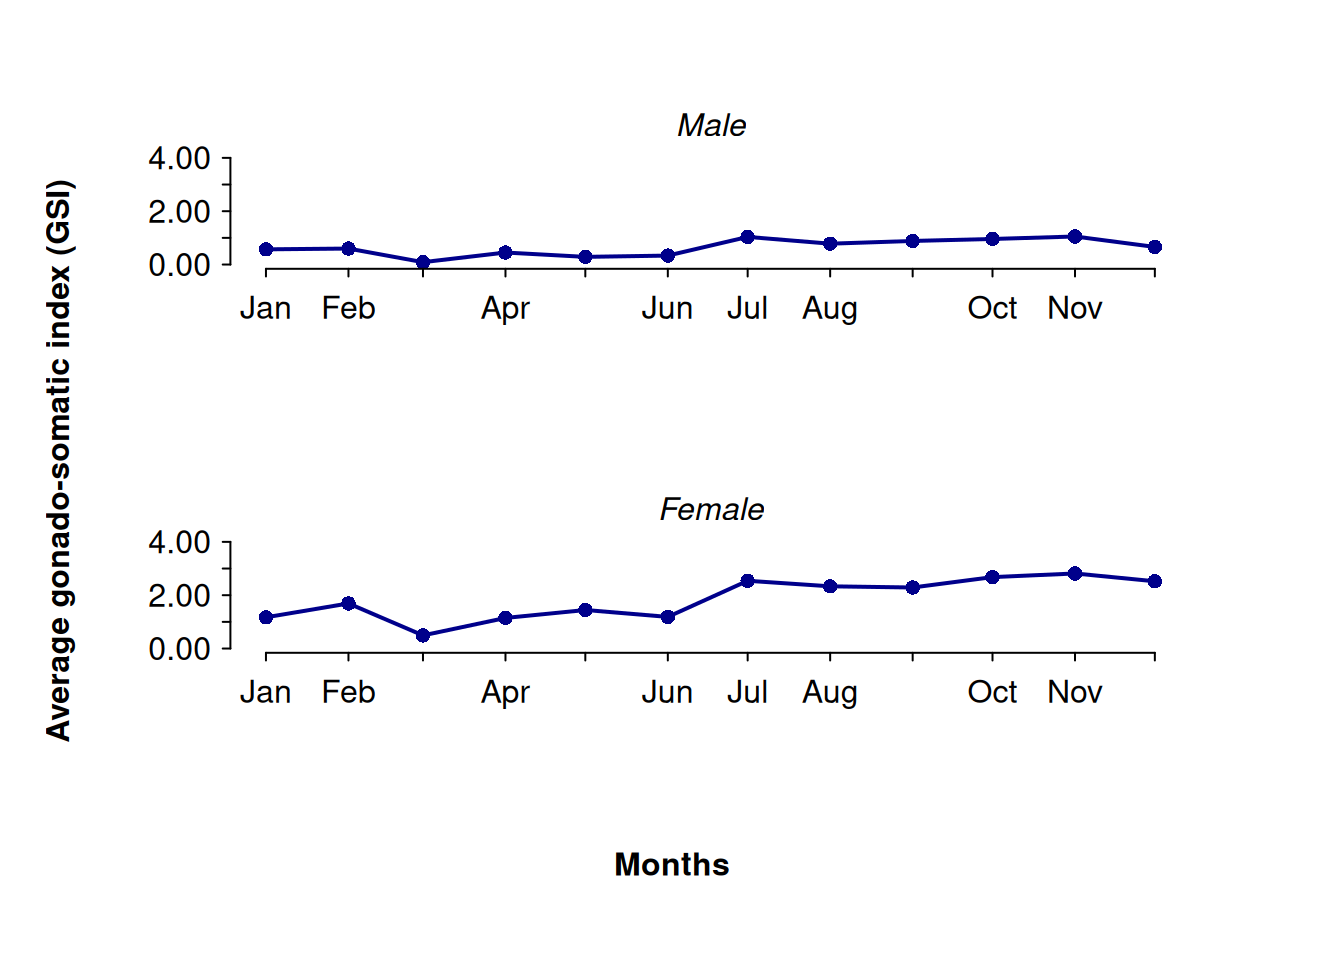
Plotting gonado-somatic index in R
This is the third and final installment in our series on conducting a reproductive biology study of fish stocks. If you missed the earlier tutorials, you can find Part 1 here…
Feb 6, 2023
Jethro Emmanuel
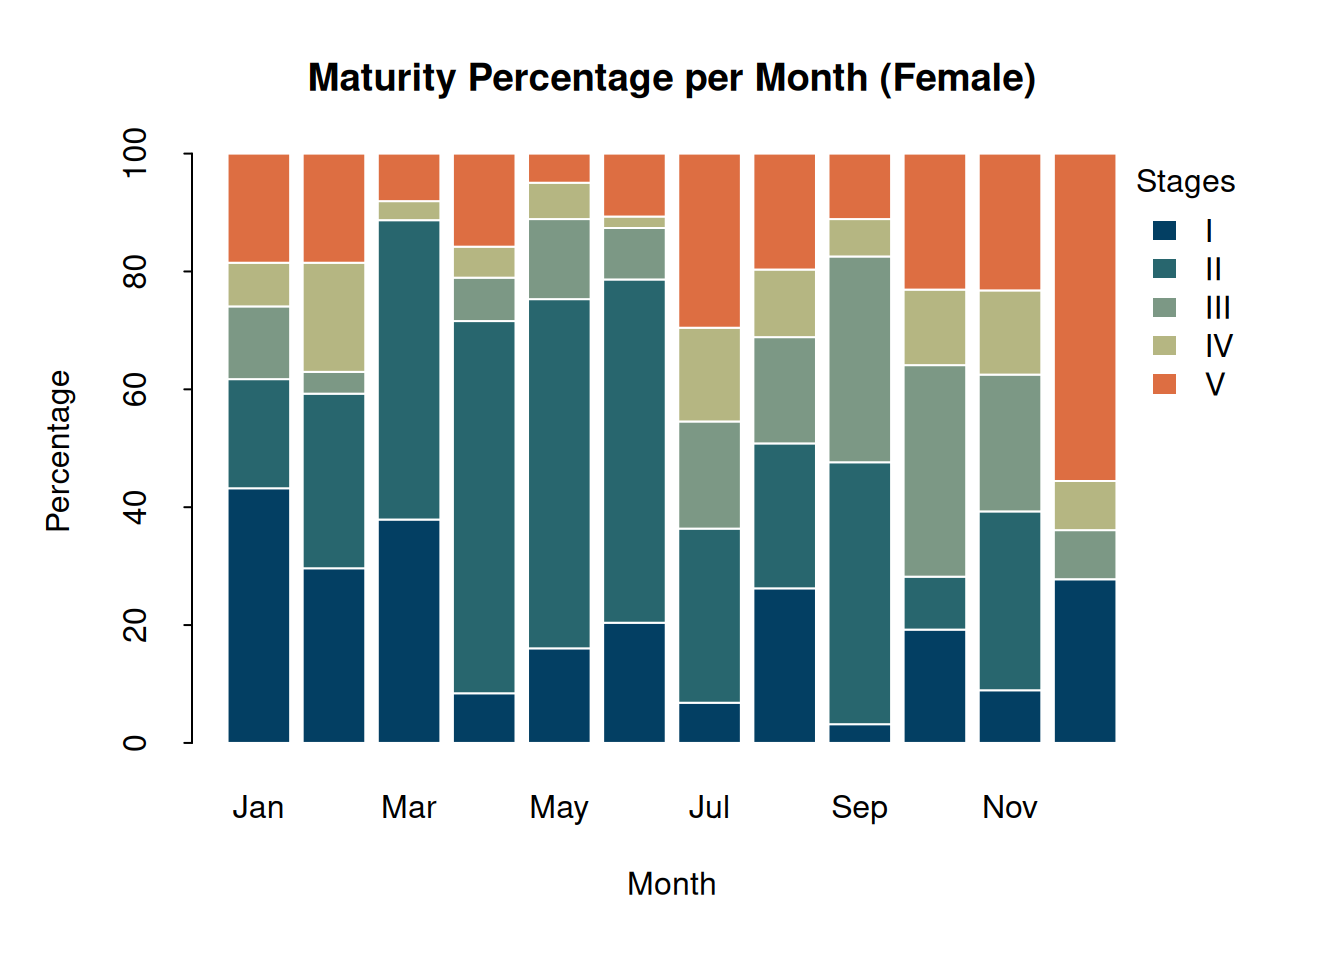
Visualizing fish gonadal stages with R
This tutorial continues from the previous one on conducting a reproductive biology study of fish stocks, which can be found here. In this session, we focus on plotting…
Jan 27, 2023
Jethro Emmanuel
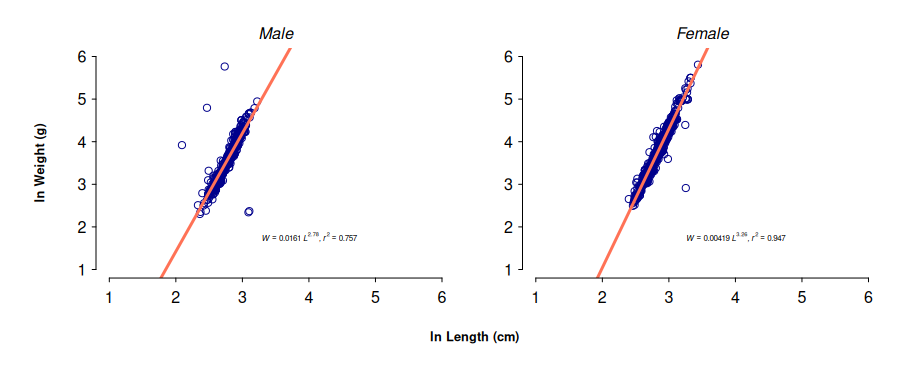
Length and weight relationship using R
Have you ever wondered how the size of a fish relates to its weight? This simple question is at the heart of an important concept in fisheries science known as the…
Jan 16, 2023
Jethro Emmanuel
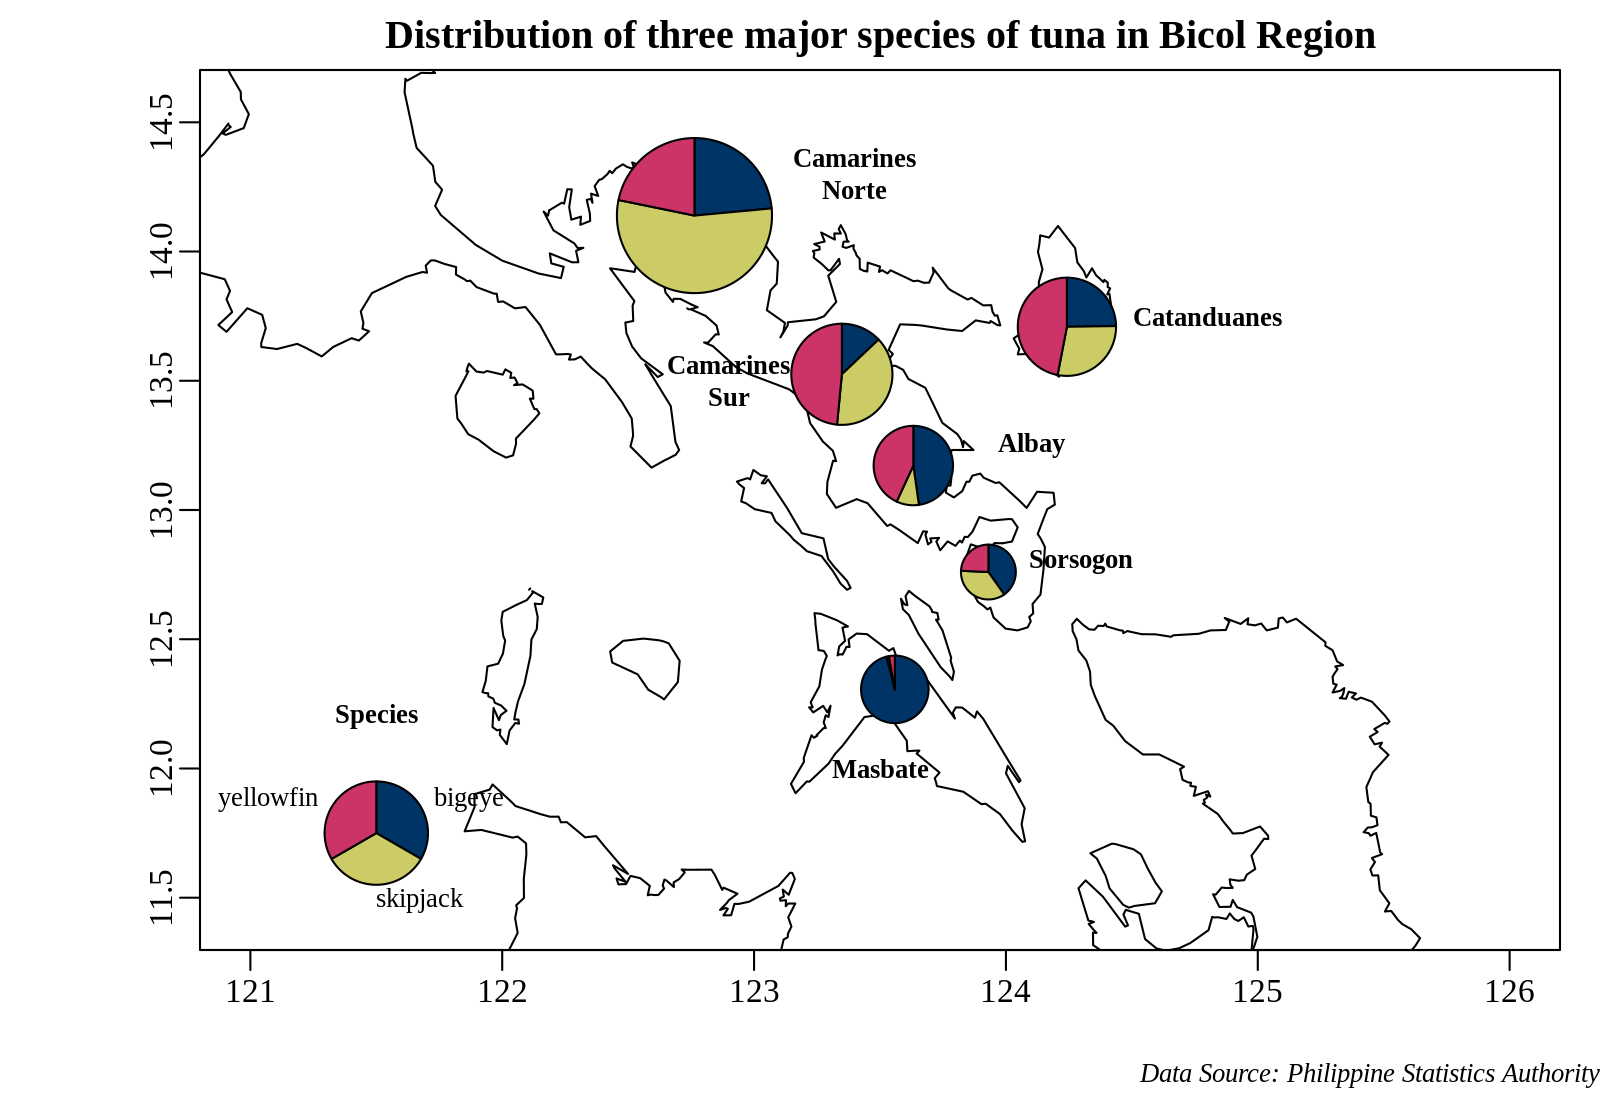
Create pie charts that show the composition of tuna landed catch on a map in R
2019-09-21
: I recently revisited this post and attempted to recreate the plot using base R graphics, along with the
mapplots
and
data.table
packages for data manipulation.
May 30, 2018
Jethro Emmanuel
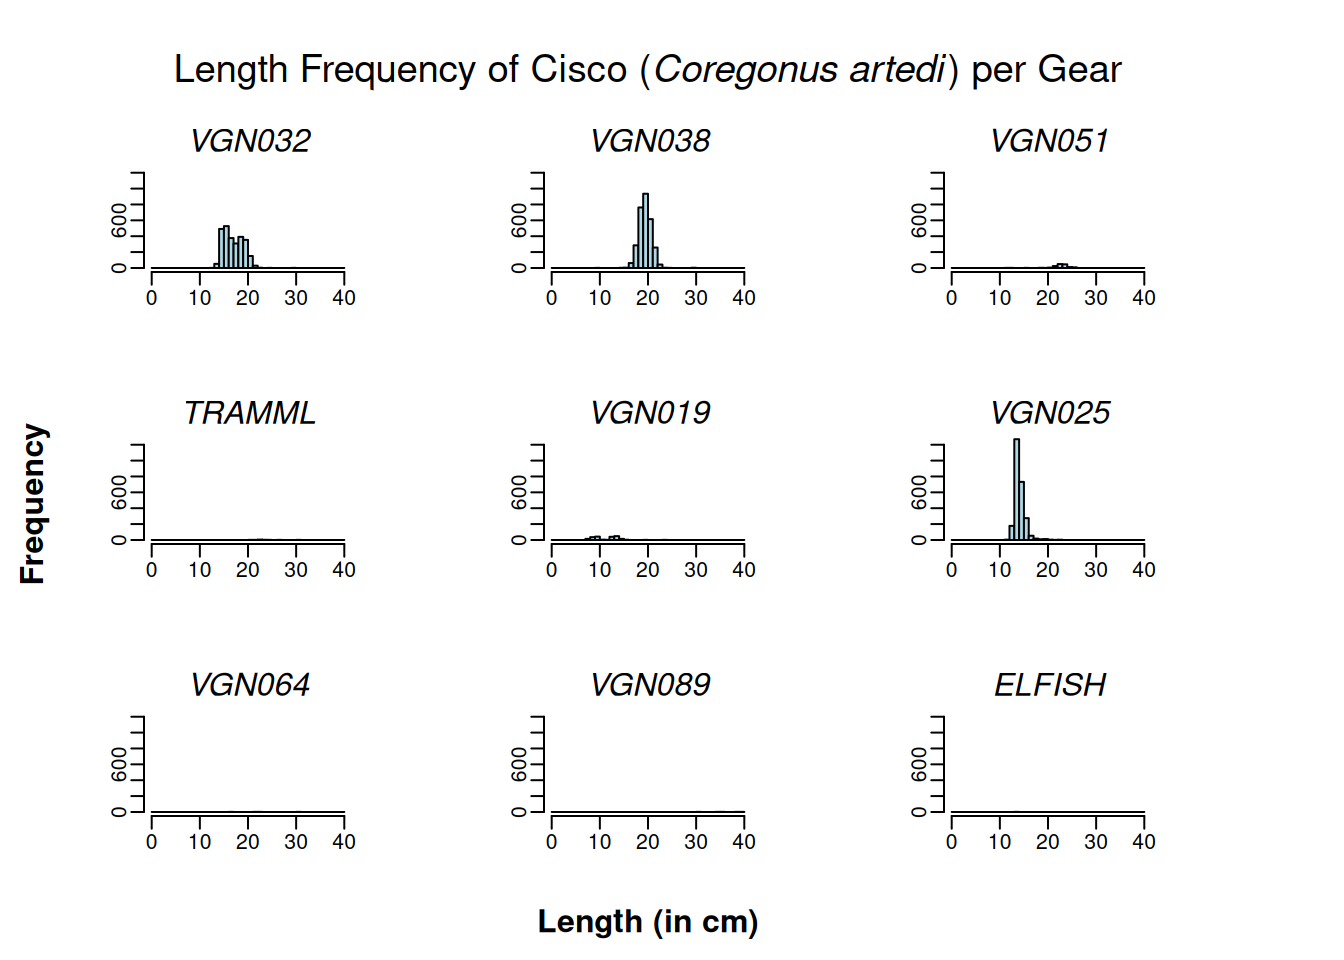
Small multiple charts for length frequency distribution
This tutorial continues from the previous one, where we created a histogram with annotations for length-at-first maturity, juveniles, mature, and mega-spawners. In this…
Jan 25, 2018
Jethro Emmanuel
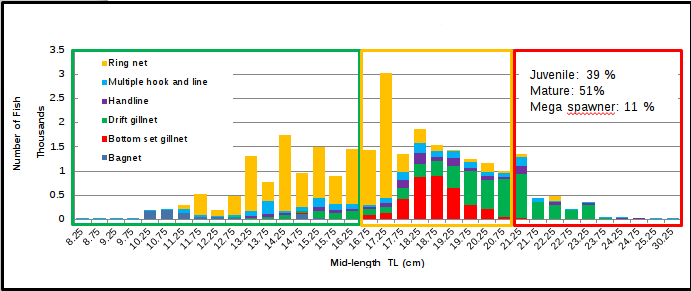
Histogram of length frequency distribution
Update:
January 16, 2018. Updated the post to include the data from
FSA
and
FSAdata
packages.
Dec 16, 2017
Jethro Emmanuel
No matching items